
Let’s take a look at the key performance indicators you should know and use when optimizing your parking revenue.
What gets measured gets improved. Every manager needs those essential vital signs that illuminate their business and align their team toward achieving their goals. Most managers understand no single metric can explain their entire operation.
So, what are the best measures of parking revenue management effectiveness? If you’ve found yourself playing matchmaker between your parking revenue and other potential key performance indicator (KPI) suitors, consider this your guide to ensuring a true, lasting connection.
Revenue
Revenue matters for your parking business. Overall revenue is your ultimate scorecard, and rising revenue is an unadulterated good.
But if revenue is up, is it because you added more capacity, or had less maintenance compared to the last period? Revenue alone can be an insufficient metric for your business, so let’s look at some additional measures to pair with it.
Occupancy
Occupancy measures how full a lot or garage is over time. In a given period, this metric shows the percentage of the total inventory in use. If you’re turning a space multiple times in a day, and the occupancy is reported at the day level, an occupancy in excess of 100 percent might be possible. Higher occupancy is always better…right? Well, perhaps not.
Demand, and its resultant, occupancy, is a function of price. If occupancy is high, are you leaving money on the table by pricing too low? When a parking business is measured on occupancy alone, the temptation is to keep prices low, or to run promotions that drive occupancy higher but short revenue.
Ultimately, you’ll find occupancy’s standards are just a little too low to get serious with your revenue.
Average Transaction Value
Average transaction value (ATV) divides the revenue over a given time period by the number of customers you served in that period. Many operations consider a rising ATV to be a win for the business. After all, aren’t you getting more revenue out of each of your customers?
If your pricing is flat over all lengths of stay, that might be an acceptable measure. But, if your business is like most parking operations, you’ll charge more for short stays, and decrease the rate per time a customer pays the longer they’re in your facility. The first day might be $10, but the sixth day is only $5, and the twelfth only $3. Yes, a 12-day customer will pay more than a two-day customer, but what if you could get 12 one-day customers, or two six-day customers, driving down ATV but capturing more revenue overall?
If your pricing isn’t flat, you probably should be trying to drive ATV down. You might make an exception if you’re managing multiple independently priced facilities with shared demand. At an airport, you might be trying to shift long-stay demand out of the crowded garage near the terminal while capturing that demand at a remote lot. That strategy materializes in an ATV that drops at the terminal garage and an ATV that increases at the remote lot.
ATV can come on too strong, ready to move in after the first date. You should probably keep playing the field.
Average Daily Rate
Average daily rate (ADR) divides the total revenue over a time period by the total number of occupied spaces and days in the period. It differs from ATV in that the amount of time a customer spends in the facility is considered. The customer who spends two weeks in a lot where stays beyond seven days are deeply discounted drives this indicator down. Surely here we have a solution to our measurement challenges?
Perhaps not. Rising ADR can be a great measure, but a business that has managed to increase ADR has the opposite challenge of one that’s managed to increase occupancy. It becomes tempting to trade occupancy for a high ADR, charging higher rates but driving away customers who might otherwise stay. If you can get just one customer to park in your lot for a single $1,000 day, that’s a nice ADR, but if you left 4,000 spaces unsold for a whole month just to find that one big spender, you’ve damaged your revenue.
Unlike occupancy and ATV, ADR’s standards are too high, never ready to settle. Poor parking revenue… But wait! There’s one last mystery guest waiting in the wings.
Revenue per Available Space
Revenue per available space (RevPAS) looks at how much revenue is earned from each available space in the lot over a given period, not from each customer like ATV or ADR. It expresses this at a day level, so if you had to take 100 spaces out of service for restriping for three days during the analysis month, this measure accounts for it.
Using RevPAS as a key indicator resists the contradictory incentives that arise when using occupancy, ATV or ADR. If a manager is tempted to discount long stays because it will drive up occupancy and ATV, RevPAS will see the lower overall revenue across that unit of time and will drop. If the manager raises prices to drive higher ADR but is also driving customers away, the number of available spaces in the lot won’t change, and the RevPAS will drop. Increases in RevPAS mean each unit of parking inventory generates more revenue.
When you want the perfect balance of beauty and brains for your parking revenue, you’ll see RevPAS was written in the stars. Because RevPAS is so robust, IDeaS recommends using it as the key measure, when paired with overall revenue when evaluating your business. Occupancy, ATV, and ADR can still be useful as diagnostic measures, but shouldn’t be the first place to look when examining your overall revenue management effectiveness.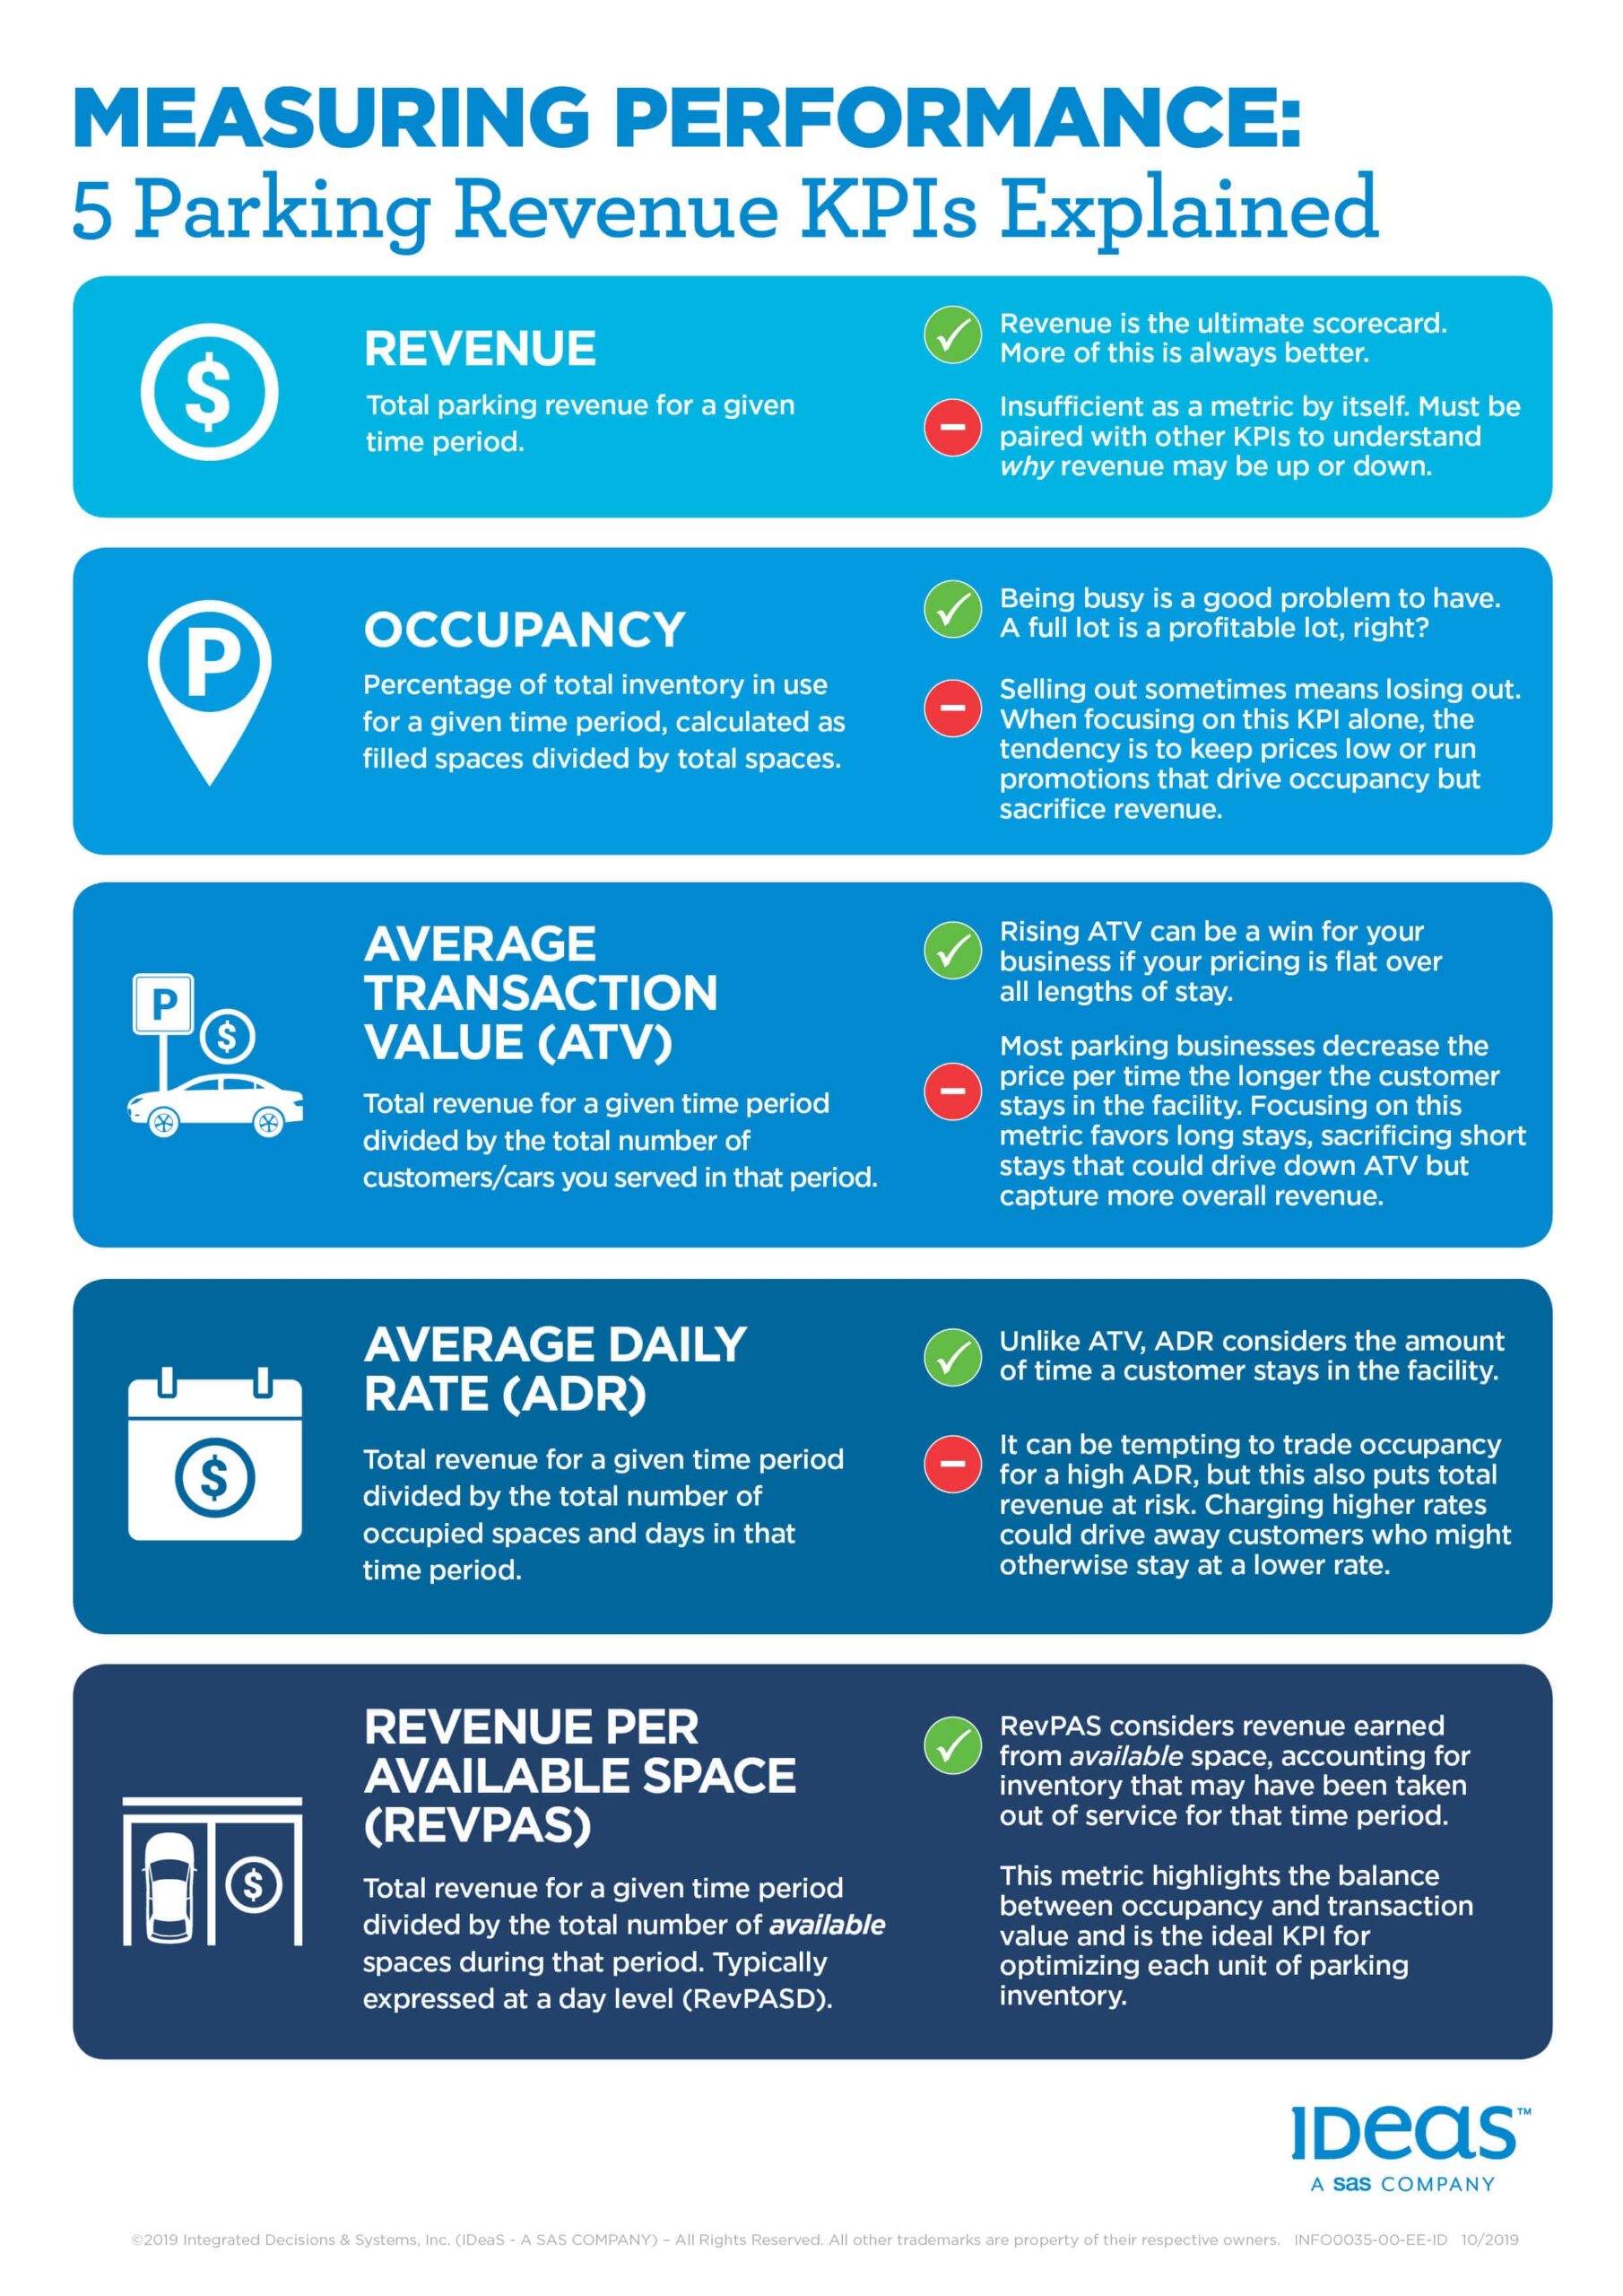

- The Dating Game – Parking Revenue Seeks KPI Companionship - October 30, 2019
