At IDeaS, we’re committed to bringing innovative, world-class revenue management solutions to our growing list of client properties. Every day, our team is hard at work to bring improvements and innovations—big and small—to life, enabling hoteliers to maximize the potential of their properties.
This blog series aims to give you a quick look at what we’ve been cooking up for G3 RMS:
Save your most frequent reports, export Rate Shopping Setup, view data for No Shows and Cancellations separately, and more! These capabilities offer better clarity in the system and increase efficiency. Let’s look at some of the highlights.
Save the Selections of Reports You Use Regularly
Now you can save a version of reports that you run regularly. After you save it, you can load that version with the same criteria from a new Saved Reports menu (under Reports), saving you time.
Saving functionality is available for the following reports:
- Data Extraction
- Pick Up / Change
- Performance Comparison
- Pricing
- Decision Pace
- Rate Plan Production

Rate Shopping – Export the Configuration to Excel
If you have many shopped room types and competitors, reviewing your setup in Excel might be easier.
You can now export your Rate Shopping setup by clicking the Excel icon in the top right of any tab. The export includes sheets for each of your rate shopping configurations.

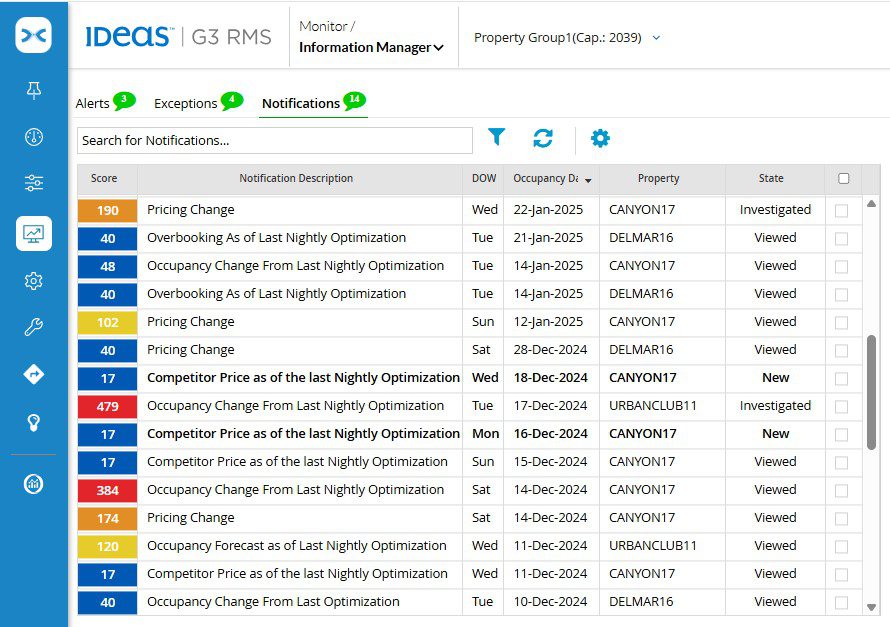
Information Manager – All Exceptions Have the Investigated State
Here’s an easier way to keep track of the status of Exceptions.
When you select any View action for an Exception, its State changes to Investigated instead of Resolved. This makes it easy for you to filter investigated Exceptions separately from those that you resolved.
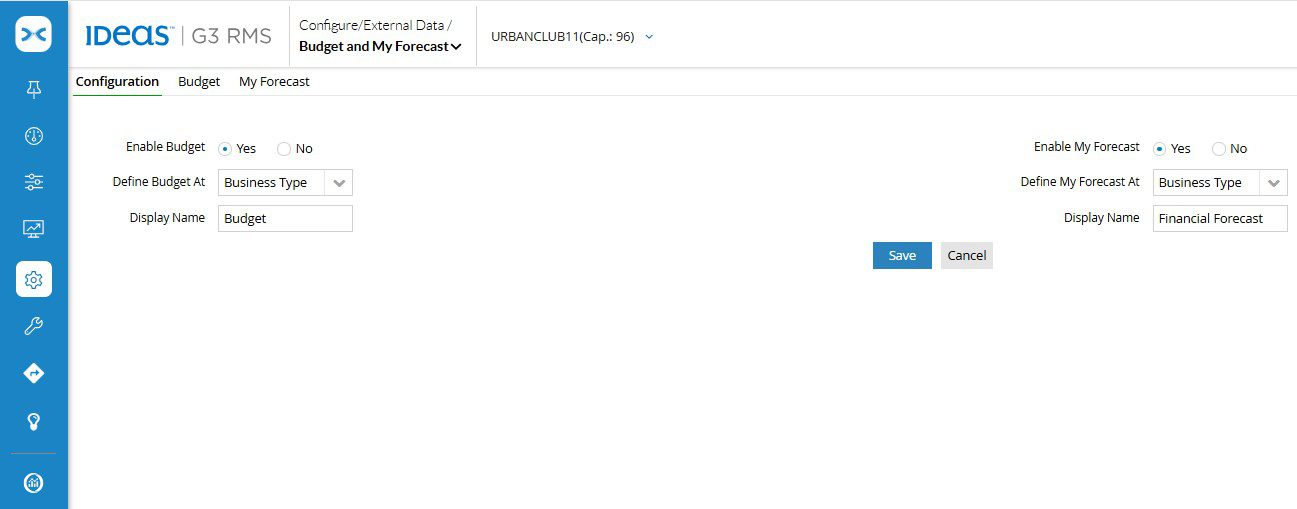
My Forecast – Enter Values by Business Type
Previously, on the Budget and My Forecast configuration tab, you could only enter Forecast data by selecting Business View. Now, you can enter your own Forecast data by Business Type (Transient and Group). My Forecast data continues to display in the following:
- At A Glance dashboard
- Business Analysis Data Details dashboard
- Data Extraction report
- Data Feed – My Forecast file
Business Insights Dashboard– View Cancellations and No Shows Separately
To help you understand how No Shows and Cancellations each contribute to your overall wash, you can now view the data for No Shows separately from Cancellations.
To view No Show data, you can select No Shows and No Shows Last Year, under Values.

Channel Forecast Dashboard Displays Data by Day
The Channel Forecast Dashboard helps you understand the expected amount of business and costs by channel. With the dashboard you now have the ability to:
- View data by Channel or Source and also by a Channel and Source combination. For example, Expedia is a Source with bookings under the Channel OTA and GDS. Previously you could display only total data for the Source Expedia, soon you can display costs for OTA-Expedia and GDS-Expedia separately.
- View Forecasted & On Books data at a monthly total, and also at a day level, for up to 31 days.
Note: G3 RMS now considers Channel as the parent of Sources. If you set up costs only at the Source level, you need to configure your default Sources in the Forecast Settings tab.

Benchmarking Alliance – New Partner for Market Performance Data
Benchmarking Alliance is a leader in a specialized competitor benchmarking data that is used to help hospitality providers gain an accurate understanding of their market environment.
If you are a subscriber, you can now see your market’s Occupancy, ADR, and RevPAR data in G3 RMS. You can compare your property’s performance to the market’s, helping you improve your revenue strategy.
You can see the market data in the:
- At a Glance dashboard, Summary table: in the Market Performance row you see monthly totals for this and the last year.
- Data Extraction report: you can add the market data by occupancy date at the Property level.
Note: G3 RMS doesn’t use this data in its optimization for forecasting and decisions.
Contact your IDeaS representative to learn more about integrating the Benchmarking Alliance data into G3 RMS.
Thank You, IDeaS Community!
We’ve been hard at work responding to your ideas submitted through IDeaShare and have implemented a total 119 ideas during 2024. Thank you for inspiring, voting for, and sharing about the features you use everyday!
Looking for more ways to keep up on features, best practices and more? Check out our calendar of upcoming learning events [requires client log-in credentials].


