For many hospitality providers, making the most of your available event space is the next chapter in total revenue optimization—but it also requires a new set of key performance indicators (KPIs) that fit the purpose.
If you’re coming from a world of rooms-based revenue management, you’re likely well-acquainted with our old friends revenue per available room (RevPAR) and average daily rate (ADR) and why they matter. But where do you start when thinking through how to track and evaluate event space performance? There’s seemingly a million ways you can slice and dice the quantifiable data associated with your event space—but what’s actually useful to measure, and why?
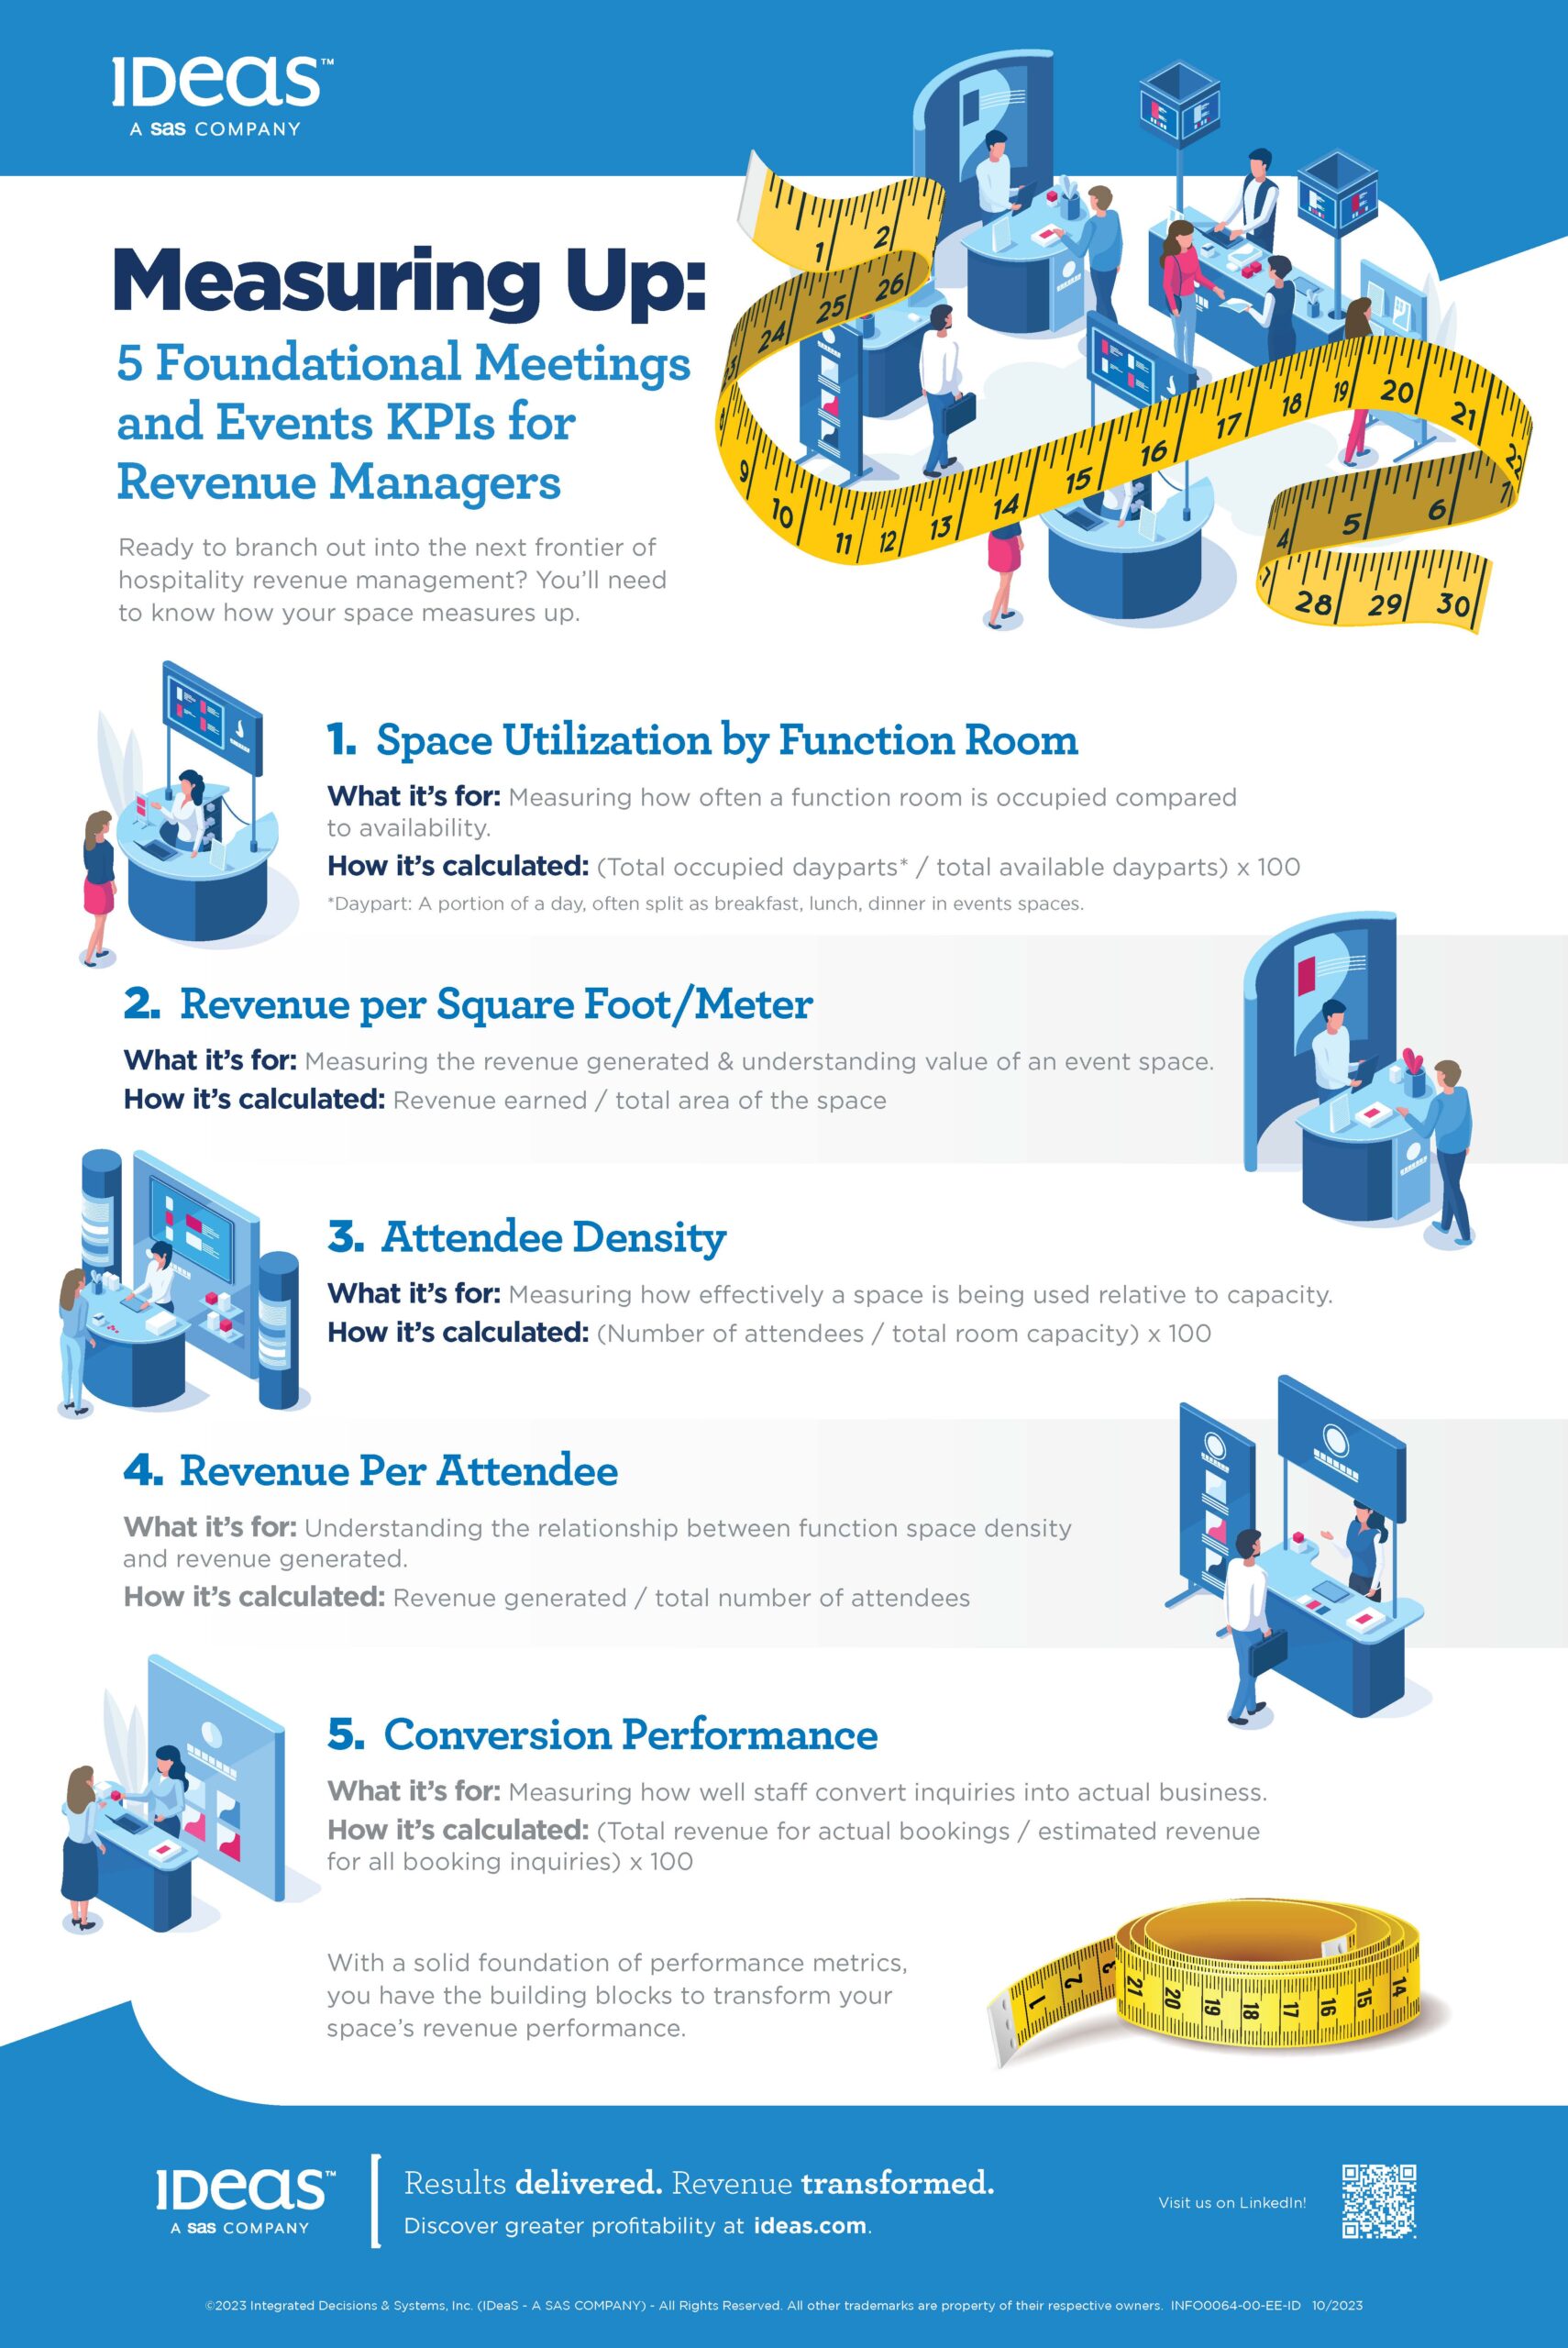
Fortunately, you’re not the first—or last—person to have these questions in the early stages of formulating a meeting and events (M&E) revenue management strategy. To help with this, we’ve identified 5 foundational meetings and events KPIs for revenue managers to get acquainted with.
5 Foundational KPIs for Event Space Revenue Management
The following key performance metrics (KPIs) are fast becoming industry standards for evaluating function space performance and setting targets for future growth.
1. Space Utilization by Function Room
Similar to room occupancy, this is a measure of how often a function room is occupied relative to its availability. It can be measured for a given month or year and divided into days or dayparts if it fits your offerings.
How it’s calculated: Divide the total occupied dayparts by the total available dayparts and multiply by 100.
Example: If a banquet room is available for three dayparts per day (breakfast, lunch and dinner), its total availability over a 30-day period is 90 dayparts. If the room is occupied on 27 dayparts during the month, its space utilization is 30%.
Why it matters: This metric helps hoteliers understand the relative value of each function room, identify high value and low value rooms, and assess how efficiently space is being used.
Hotels can fill their meeting space with all kinds of catering business, or use their meeting space as an avenue to fill sleeping rooms, but to properly measure the success of an M&E strategy this metric is pivotal. Understanding your revenue performance, in relation to the available space, allows hotels to set benchmarks for M&E performance which leads to the effective utilization of space.
2. Revenue Per Square Foot (or Meter)
This measures revenue generation by area in a given room or for all function space combined. It can be calculated per event or by daypart, day of week, month or year.
How it’s calculated: Divide the revenue earned by the total area of the space.
Example: If a boardroom earns $35,000 in a year in revenue and is 1,200 square feet in area, its revenue per square foot is $29.17.
Why it matters: This metric helps hoteliers understand the relative value of each function room, identify high value and low value rooms, and assess how efficiently space is being used.
Hotels can fill their meeting space with all kinds of catering business, or use their meeting space as an avenue to fill sleeping rooms, but to properly measure the success of an M&E strategy this metric is pivotal. Understanding your revenue performance, in relation to the available space, allows hotels to set benchmarks for M&E performance which leads to the effective utilization of space.
3. Attendee Density
This is a measure of how many attendees occupy a function room relative to its maximum or optimal capacity. It can be calculated for a specific event or setup type (e.g. theatre, classroom, banquet, etc.) over a given period such as a month or year.
How it’s calculated: Divide the number of attendees by the room capacity and multiply by 100.
Example: If Ballroom A has an optimal capacity of 500 and 130 people attend an event, the attendee density for that event is 26%.
Why it matters: This helps hoteliers understand how well function space is being used relative to its capacity. If density is low, it suggests that the space is being underutilized. However, capacity and F&B revenue can vary significantly by setup type. For example, a banquet typically generates more revenue than a boardroom meeting.
This metric can be useful for several purposes, depending on the details of your event space. Take a property with a large ballroom that can be reconfigured into smaller spaces. You may find the large space is consistently underutilized while you’re turning away business fit for smaller event spaces. That information, when paired with metrics like revenue per attendee (or better yet, profit per attendee) for similar events, can help guide the sales decision process.
4. Revenue Per Attendee
This is a measure of the average revenue generated per attendee. It can be measured by event or function room over a given period such as day of week, month or year.
How it’s calculated: Divide the amount of revenue generated by the number of attendees.
Example: If a welcome reception takes in $13,500 in revenue and has 260 attendees, the revenue per attendee is $51.92.
Why it matters: This metric helps venues understand the relationship between function space density and revenue generation. Generally, the higher the revenue per attendee is, the more profitable a function is, although costs must also be considered.
Bigger picture, this can help you properly compare the business value of an event booking and guide sales decisions—particularly when accounting for overall profitability you know that a corporate retreat typically generates X amount of revenue with low additional operational costs, and a wedding typically generates Y amount of revenue with higher operational costs, you’ll have a better understanding of which to accept.
Additionally, this can be a key metric for properties that choose to implement a daily delegate rate (DDR)—that is, offering a per-person, per-day pricing bundle that includes sleeping rooms, event space, food & beverage, and other services—as it sets a baseline for your different function spaces. Once that’s established, you can set optimal pricing per attendee by function room.
5. Conversion Performance
This is a measure of how well sales staff convert inquiries into actual business. It compares the value of definite bookings to the potential value of all booking inquiries, including lost business. It can be measured by month or year and be applied more granularly by team member, market segment, event type or number of inquiries.
How it’s calculated: Divide the total revenue for actual bookings by the estimated revenue from all booking inquiries and multiply by 100.
Example: If a catering sales manager received booking inquiries worth $375,000 in the year and converted $123,000 in actual revenue, her conversion performance is 32.8%.
Why it matters: This metric is often illuminating to hotels and event venues because it provides a measure of performance for individual sales managers and sales teams. It can also provide an indication of the likelihood of bookings going definite.
This also provides an investigatory springboard for several areas of improvement. For instance, if you’re inundated with booking inquiries that are logistically impossible to fulfill, maybe it’s time to tell your marketing team to cut back on advertising. Or if you’ve identified a high value M&E market segment that converts easily, maybe it’s time to spend more effort attracting similar business.
Power in numbers
When it comes to uncovering actionable insights, the above metrics are especially helpful when used in combinations. For example, if Ballroom C has an average space utilization rate of 42% for the month but average revenue per attendee is only $17, it suggests that the room isn’t being optimized to its full revenue potential—and that’s worth investigating. A closer look at revenue per square foot, attendee density and costs will also provide insights into true performance and opportunities for improvement.
Ultimately, many of these metrics are a starting point that can feed into more advanced profit-centric measurements like profit per available space/time (ProPAST). With the right measurement criteria in place, you’ll soon have a key piece of the structure needed to experiment, measure, and refine your meeting and events space strategies.
To learn more about how IDeaS can help you optimize your event space, visit the Meeting and Events Strategy page.