Visualize better revenue for your business.
What if you could take your revenue performance data deeper — and display those insights in a highly visual format to instantly understand and act upon? Unlock these capabilities with IDeaS Revenue Performance Insights™.
IDeaS Revenue Performance Insights
Click a number for more feature detail:
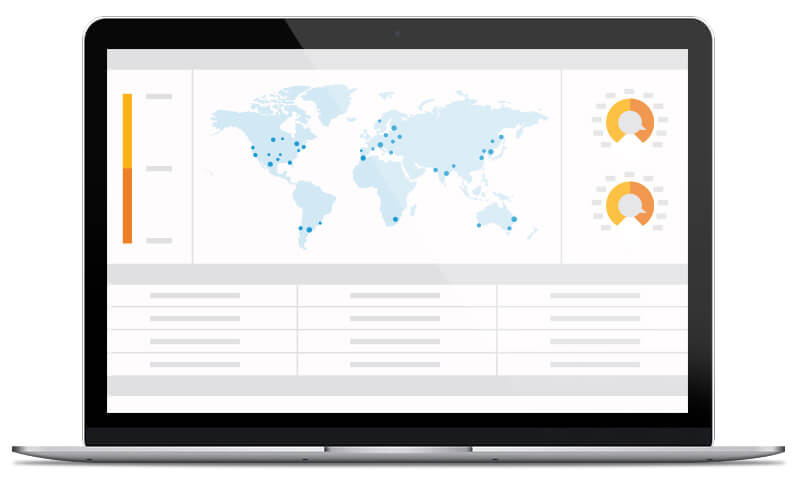
Dashboard views
Graphical dashboards enable at-a-glance views of key enterprise or property-level metrics.Performance maps
Quickly identify underperforming and “superstar” properties across your estate.Personalized reporting
View information that is pertinent to your job role.Intuitive comparisons
Assess multiple reports side-by-side to recognize new patterns and guide decision-making.
Leveraging advanced SAS® Visual Analytics, the easy-to-implement, cloud-based IDeaS Revenue Performance Insights solution allows you to view, collaborate upon, and generate visually impactful reports from IDeaS Revenue Management System and other data sources that can be absorbed at a glance.
Request a DemoGraphical dashboards enable at-a-glance views of key enterprise or property-level metrics.
Quickly identify underperforming and “superstar” properties across your estate.
View information that is pertinent to your job role.
Assess multiple reports side-by-side to recognize new patterns and guide decision-making.
Highly intuitive charts, graphs and dashboards empower decision-makers to spot patterns fast — and capitalize on opportunities first.
- Gain a clear visual snapshot of revenue performance across your estate
- Sharpen your knowledge of key performance indicators
- Quickly uncover formerly undetectable business issues
In just over a year, we are enjoying enormous value from the IDeaS system. We’re able to avoid occupancy spikes on peak demand dates. Utilizing IDeaS’ Last Room Value and BAR by Length of Stay model has really allowed us to maximize our performance on shoulder dates. We’ve seen significant occupancy jumps and rate growth this year, which is confirmed by our improved STR ranking.
The Lenox Hotel

IDeaS Consulting Services
Technology adoption is only the beginning of every revenue management journey. That’s why IDeaS offers a suite of expert advisory services to help you create and maintain a winning revenue culture.
Explore the possibilities →