
Keep your finger on your property’s pulse without breaking a sweat this holiday season.
It’s Monday morning. You’ve got your cup of coffee and a sensible breakfast. Time for work as a cluster revenue manager—but where to start?
If you’re someone like Paula Mullaney, commercial director, Staycity Aparthotels, for whom “Optix has become the revenue team’s go-to first thing each day,” you instinctively fire up IDeaS Optix, the advanced reporting and analysis module for IDeaS G3 RMS. It’s always a good tool to prioritize which properties need your focus.
However, the work you did last week has you confident in each property’s position. You understand the overall picture but find yourself asking, “What’s changed since Friday?”
Well, good news—Optix can help you with this! The Pickup & Change Dashboard is here to highlight exactly what’s picked up since the last time you logged in. Sporting a sleek month-by-month view, it couldn’t be faster to see incoming bookings across the entire year.
Bright colors and clear charting help you spot unexpected spikes in reservations and those unfortunate cancelations. Summary metrics and KPIs let you judge your pickup in Rooms, Revenue, or ADR in a heartbeat.
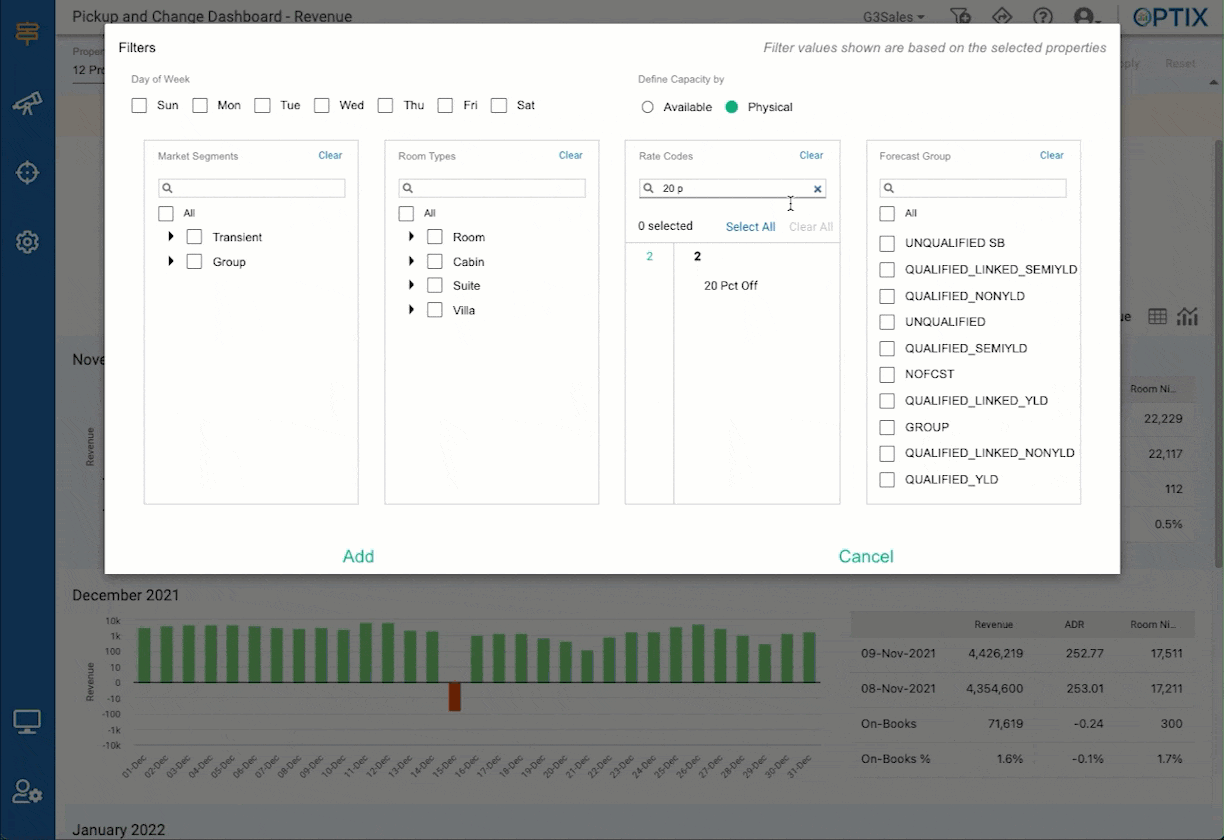
Of course, Optix’s impressive filtering applies here, too. View pickup for a single property you manage, or pivot to a region or the full estate pickup (for those with multiple properties). Quickly isolate group or transient business to better understand each performance independently. Focus your analysis to a specific Room Class or Segment’s pickup. It couldn’t be easier.
It’s the Most Promotional Time of the Year

In the United States, properties are gearing up for Black Friday sales following the Thanksgiving holiday. According to a study by IBM’s Institute of Business Value, it’s anticipated Americans’ spend on travel could increase by $600 million during Black Friday and Cyber Monday. Wouldn’t it be nice to watch the pickup generated from that promotion as it comes in for a single property, by market or the entire portfolio?
With these near real-time insights at your fingertips in the Pickup & Change Dashboard you can easily measure effectiveness of the promotion and quickly understand if promotion strategy and tactics should be modified. Simply select the rate codes being used and the entire page will isolate that promotion’s pickup alone. Save it as a custom-filter and check on it again each day—or take it to any other dashboard in Optix for further analysis.
And the Pickup & Change Dashboard isn’t just for pickup. It can also show changes in IDeaS G3 RMS’s forecast. See how each day’s forecast has adapted since the beginning of the week, month, or year. Apply the same filtering here as well for detailed analysis.
Whether you’re managing one or multiple properties, Optix gives you the tools to quickly understand what’s changed and where you should focus your time. If you’re still pouring over spreadsheets of outdated data trying to glean insights, you should give Optix a try. We’d love to give you a demonstration! Please reach out to your IDeaS representative to find out more.