
It seems lately every annual planning cycle brings a familiar challenge. Leadership teams are asked to prioritize investments for the year ahead while working with forecasts that feel incomplete. Demand patterns remain uneven across markets. Cost pressures persist. The broader economic outlook offers few clear signals.
In conditions like these, many organizations reach a similar conclusion: delay investment decisions, preserve cash, and wait for greater certainty.
That instinct is understandable. In uncertain environments, caution can feel like discipline.
But in hospitality, delaying decisions does not pause outcomes.
Hotels continue to operate every day. Inventory expires nightly. Demand shifts continuously. Pricing, availability, and distribution decisions are still being executed—whether intentionally or by default. When an organization chooses to wait, it is allowing existing tools, processes, and constraints to keep shaping results in a changing market.
That is why “doing nothing” is rarely neutral in this industry. It carries a real, measurable cost.
One useful way to understand that cost is to think of it as a set of hidden taxes—recurring penalties imposed not by regulation, but by inertia.
A Structural Reality Worth Acknowledging
It is important to ground this discussion in context. Despite years of progress in hospitality technology, most hotels still do not operate with a full revenue management system.
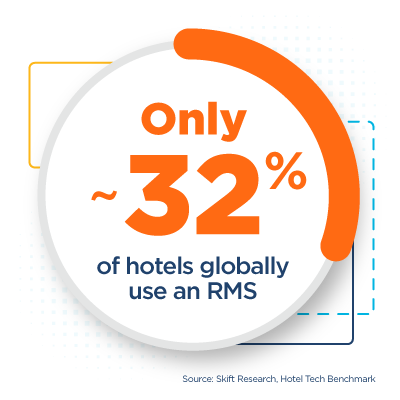 According to Skift Research’s Hotel Tech Benchmark, only 32% of hotels globally use an RMS. And within that estimated 32%, only a portion are built to adequately handle the complexity and volatility of hospitality demand. That means the majority of properties still rely on manual processes or limited tools that were not designed for today’s level of demand volatility.
This matters because the costs described below are not limited to underperforming organizations. They are structural constraints that affect even disciplined teams when systems cannot respond quickly enough to change.
Hidden Tax #1: “The Revenue Leakage Tax”
It’s a central, foundational truth to any hotel—your inventory is perishable. Once a room night passes unsold, or sells at a lower value than the market would have supported, that opportunity is gone, with revenue slipping through the cracks.
Organizations relying on manual, static, or otherwise unsophisticated revenue management approaches often experience this as gradual underperformance rather than a clear problem. Occupancy may appear strong. Rates may seem reasonable. Yet value is still left unrealized because decisions cannot continuously adapt to demand signals.
Aggregated benefits measurement across hotel clients using advanced RMS capabilities shows material performance differences compared to manual or limited revenue management practices. Published results indicate:*
- Up to ~7% uplift versus standard revenue management practices
- Up to ~15% uplift versus manual or no revenue management practices, with results varying by property, market, and adoption
Before you fixate on the exact percentage of uplift and the myriad reasons why your team’s approach is different and doing just fine—this data shows revenue leakage is often a structural problem. Systems that react slowly tend to leave revenue unrealized, even in the hands of strong performing, highly engaged teams.
This “leak” behaves like a tax because it is paid quietly and continuously. It does not require a major, glaring mistake to show up and cause pain. It accumulates through small mismatches between price, availability, and demand — repeated day after day.
Hidden Tax #2: “The Inventory Misallocation Tax”
Revenue management is often discussed as a pricing discipline. In practice, outcomes are shaped just as much by inventory controls: which demand is accepted, which is restricted, and when capacity is protected for higher‑value business.
When inventory controls are blunt, static, or inconsistently applied, hotels can unintentionally prioritize demand that looks acceptable in isolation but limits higher‑value opportunities later. This is particularly common during periods of compression, when demand arrives in waves and timing matters.
The challenge is that misallocation rarely looks like obvious failure. Rooms still sell. The property may still reach high occupancy. But the mix of business is not as valuable as it could be.
Because the hotel fills, this tax on the property’s potential remains hidden. Over time, however, repeated misallocation reduces yield and masks unrealized upside.
Hidden Tax #3: “The Decision Delay Tax”
Volatile markets reward speed and responsiveness. Yet many commercial teams still operate with decision cycles designed for more stable conditions.
When strategy-shaping insight depends on manual reporting, spreadsheet reconciliation, or fragmented systems, decisions often arrive late — even if they are technically correct. By the time a change is identified, the opportunity to act may have already passed.
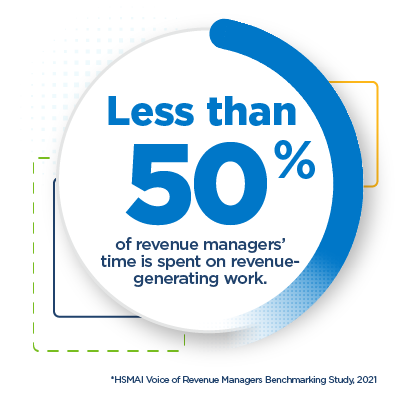
Industry research underscores this challenge. A recent HSMAI Voice of Revenue Managers Benchmarking Study found that less than half of a revenue manager’s time is spent on revenue‑generating activities, with data collection and reporting among the most time‑consuming tasks.
When demand patterns shift daily, delayed decisions carry a measurable opportunity cost. This cost grows as markets become less predictable and as portfolios become larger and more complex.
Hidden Tax #4: “The Labor Misallocation Tax”
Most hospitality organizations are operating with lean commercial teams. At the same time, many of those teams spend substantial effort on low‑value tasks because systems cannot reliably handle routine monitoring and execution.
When experienced revenue and commercial leaders are focused on assembling data or validating numbers, strategic work is displaced. Tests are postponed, segments go unexamined, and scenarios are not explored.
This tax is difficult to quantify because it does not appear as wasted headcount. Instead, it shows up as strategic capacity that never materializes.
With this tax, the organization does not fail to act. It simply never reaches the point where certain decisions are considered at all.
Hidden Tax #5: “The Commercial Misalignment Tax”
As budgets tighten, coordination across revenue, marketing, and sales becomes more important. Yet many organizations still struggle to align these functions around a shared, forward‑looking view of demand.
Without common signals, marketing may invest in periods that would have filled without intervention. Sales may pursue business that displaces higher‑value demand. Revenue teams may struggle to demonstrate whether specific actions produced incremental results.
This misalignment creates two recurring costs: wasted effort and missed opportunity. Because these costs are distributed across teams and budgets, they are easy to rationalize and hard to trace back to a single cause.
Over time, however, they represent a real drag on performance — especially in environments where every investment is under scrutiny.
Hidden Tax #6: “The Forecast Credibility Tax”
For owners and boards, performance is ultimately evaluated not just on annual results, but on consistency, governance, and scalability.
Consistent, repeatable commercial performance builds confidence in forecasts, rollout decisions, and long‑term asset value. When outcomes depend heavily on manual intervention or local workarounds, that confidence erodes.
Without that confidence, forecasts feel less reliable. Performance becomes harder to explain and harder to repeat.
Even modest inefficiencies, when recurring, can influence how risk is perceived and how value is assigned. That risk perception—and its influence on valuation—can have a tremendous downstream impact on a property’s overall financial health. From this perspective, doing nothing does not preserve value. It quietly undermines it.
Summing It Up
Delaying investment decisions can feel prudent in uncertain times. And in some circumstances, it may be. But keep in mind, a delayed decision isn’t a neutral decision.
Inaction just allows existing limitations to persist as the market changes around them.
For RMS modernization upgrades, the cost of doing nothing is not necessarily going to be dramatic or immediate. But it does keep in place the accumulation of small, persistent penalties across pricing, inventory, speed, labor, and alignment.
Each one may be survivable on its own. Together, however, they can begin to fester and create a structural disadvantage that compounds over time.
In uncertain markets, the most important question to consider is not whether to invest. It is asking where inaction is already costing more than action.

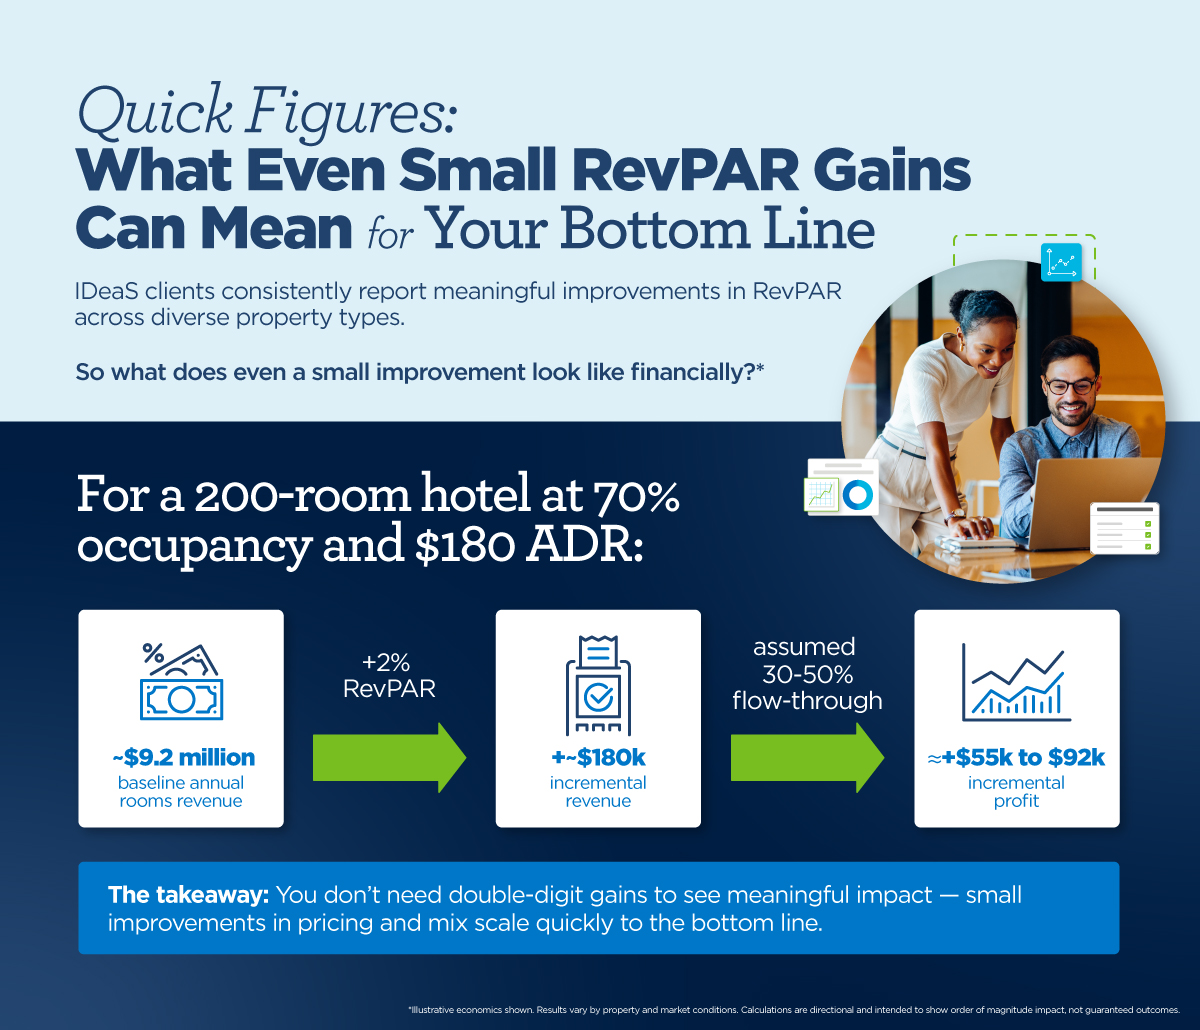
Do The Math
Is the strain of subpar revenue performance dragging your property down? See the impact IDeaS could have on your hotel.
*Source: IDeaS Benefits Measurement, aggregated client results (sample ~100 properties globally; methodology compares against manual/no RM and standard RM practices; results vary).