
How small slices of demand impact big-picture forecasts
- Collecting lost business data is both insurmountable & impractical in forecasting
- Hotels need to consider all of their demand for a profitable revenue strategy
- Using a small fraction of your data only short changes your big-picture strategy
I recently caught a pie-baking competition at a local county fair.
(No judgements; it’s the Midwest. And because, pie.)
While admiring the pies vying for the blue ribbon, I naturally started thinking about how pies and hotel demand actually have something in common: their sampling size.
I mean, think about it: Would one enter a small slice of pie into a competition? Or would they enter the whole pie for the win?
In the revenue technology realm, what about using small slices of hotel demand—such as lost business—to make big-picture forecasts? Is that enough, or should technology evaluate a larger set of considerations to determine total hotel demand?
To illustrate further, let’s bring this back to an era some hoteliers refer to as The Glory Days. You know, before the internet and third-party OTAs became a thing, and hotels were living their best life.
As part of the process to determine total hotel demand, hotels had to find ways to quantify their lost business. Lost business, in general, is comprised of two types of data: a regret and a denial.
Both represent a lost opportunity; however, they are classified using different reasons:
- A regret represents a missed booking because a rate exceeded the shopper’s budget
- A denial represents a guest turned away because the date or room type was not available
Not exactly what you’d call a scientific method for evaluation, right? But at the end of the day, classifying missed opportunities in a simple manner helped fill a void in understanding total hotel demand.
But even in those simpler times, it still wasn’t simple to determine the exact reason behind every piece of lost business.
Now fast-forward back to today.
Guests have ample channels to search, shop and book hotel accommodations. Thousands of travel site choices exist, and they range from OTAs, meta and brand.com sites to traditional voice and GDS channels.
This growing technology superstorm means that collecting lost business data has become both insurmountable and impractical—especially when it comes to using denials to forecast hotel demand.
So in the spirit of pie, here are some pie graphs that carve out why using denials to forecast demand is dangerous for a hotel strategy.
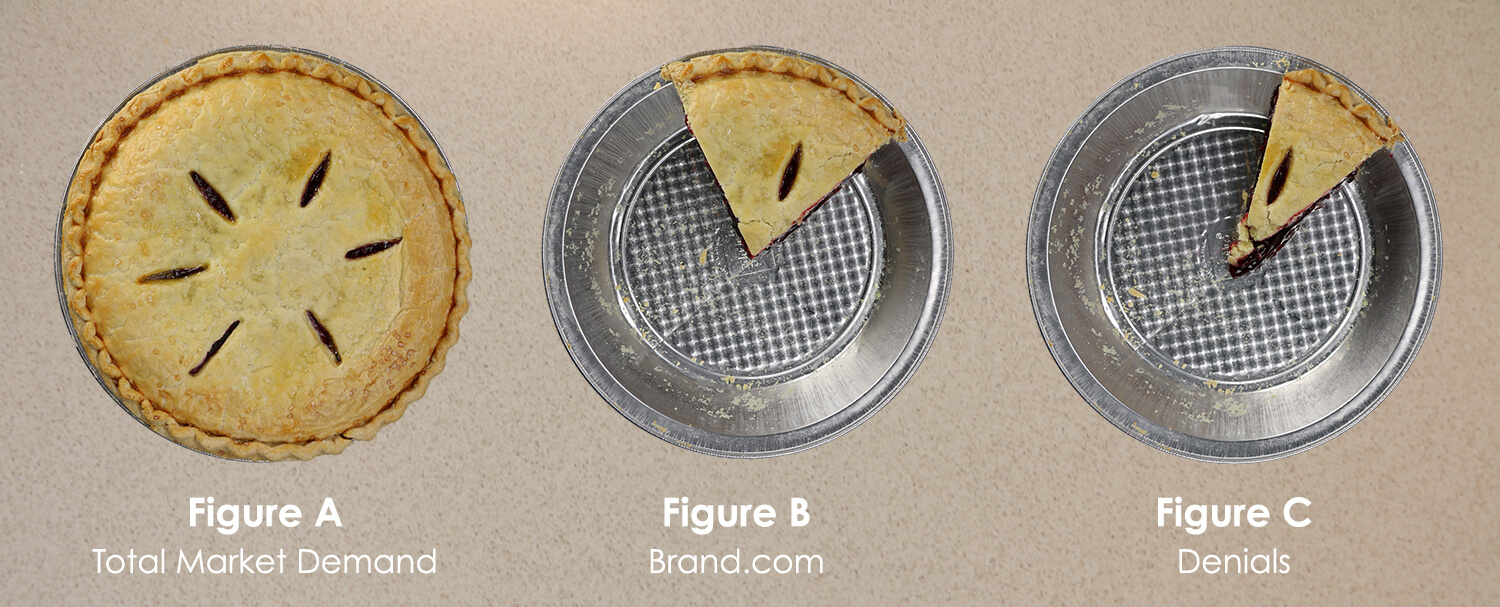
In the image above, Figure A represents the whole pie, which is all the demand that exists in the market. This is inclusive of every person shopping and booking hotel accommodations on all channels.
Figure B is the portion of those guests shopping on a brand.com site.
And, finally, Figure C represents the amount of denials that occur during those direct website shopping instances.
Technology using denials data to create their demand forecast ends up making assumptions on all behaviors based on this one small piece of the pie.
This means that hotels are forecasting with, and sampling from, just a fraction of their available data. This is particularly troublesome considering demand forecasts are the foundation for a hotel’s overall revenue strategy.
Then there’s the other facet of lost business: whether or not to analyze regrets. Regrets represent the guest that shopped at your hotel, but ultimately chose not to book.
Why is using regrets data such a tricky strategy? Mainly because it’s difficult to know exactly why the guest didn’t book.
There are a variety of different reasons that come into play here: price, location, online reviews—maybe they liked your competitor’s Instagram pictures more.
They could also be shopping on their phone, but want to book later from their tablet. And if you go even further down that rabbit hole, mobility brings about more questions: What room type should you attribute demand to when all your room types are displayed on the same page?
There are many reasons why lost business data has an adverse effect on forecasting capabilities, and hotels need to consider all of their demand for their most profitable revenue strategy.
Here are a couple of areas to help you achieve that:
- Leverage revenue technology that forecasts demand through a statistical analysis approach
- This means historical and future-looking data are used in your forecast models—not a small sampling of data making assumptions about the rest of your business
- Historical data is important, but so is competitor rate shop info, reputation scores, future reservation data and shopping behavior across thousands of online sites
- Once you’re forecasting with the whole pie, make sure your technology can automate this analysis through its algorithms and optimization process
- Go beyond displays and reports— leverage all this powerful data through automation for a holistic revenue strategy
Using a small fraction of your data only short changes your big-picture strategy. While we may not be living in simple times any more, we are definitely living in more exciting times.
Hotels leveraging their big-picture data through technology and automation are finding themselves in The New Glory Days.
After all, it’s time hotels start living their best lives again.

- Presenting the Holiday Gift Guide for that Special Hotel In Your Life - November 10, 2020
- Twice in a (Work) Lifetime – A Tale of Two Tech Companies - March 26, 2019
- Channel Performance Revs Up Profits for Hoteliers - April 11, 2018
